
Sunday, June 16, 2013
Thursday, June 13, 2013
The 30-60-90 Approach to Retirement Planning, Part 3: Adjusting the Savings Formula for Different Saving Periods

In Part 2, we have seen that using the 30-60-90 approach, and assuming an annual real investment return of 4.7%, you should save an amount equal to
Savings = Expenses/4
Where "Expenses" is your estimated monthly or yearly retirement expenses at today's prices.
But what if you don't closely fit the 30-60-90 scenario? What if, for whatever reason, you decide to start saving for retirement much later, like say, age 40? How can we adjust the savings formula above to better reflect your decisions?
Starting to save for retirement later than age 30 will obviously result a higher savings amount since you'll have less earning years to prepare for the same amount of retirement expenses. If you start at age 40, for example, then your savings for the entire year should be enough not just for year 60--your first year of retirement--but also a portion of your expenses in the following year. Furthermore, whereas in the 30-60-90 scenario all your retirement fund deposits have a 30-year horizon, starting later shortens your investment horizon correspondingly and exposes your retirement portfolio to greater risk.
To adjust the savings formula in order to reflect a variable saving period y, take the following. Assuming constant prices, you expect to spend an amount E every year starting on your 60th birthday--the beginning of retirement--for 30 years until you turn 89. You plan to finance your retirement by contributing an amount S every year to your retirement fund, starting on your (60 - y)th birthday, for y years until age 59. If your retirement fund earns a real rate of return r, then the future value of all S payments should equal the present value of all E expenses on your 59th birthday. In equation form, using the formula for future value and present value of an annuity, we get
S*[(1 + r)^y - 1]/r = E*[1 - 1/(1 + r)^30]/r
Simplifying,
(I apologize, this equation can't be simplified any further.)
As an example, if E = 32,000, r = 4.7%, and y = 20, then
Or almost double the savings amount if you start at 30 years old, or just half of the expense estimate. If you use y = 30 as in the 30-60-90 scenario, you'll actually get the original equation S = E/4.
Finally, you can also use the above formula for different saving and retirement periods. If z = the number of years of retirement, just replace "30" by z so that
So if you're now 30 years old and you plan to retire by 50 and you retain the planning horizon of up to 90 years old, then y = 20 and z = 40. Using the same E and r,
Remember that these estimates are only for the amount that you need to save in your first year (age 60 - y). For subsequent years, you need to adjust for inflation, like in the Part 2, but this time with a slightly different factor
S = E*[1 - 1/(1 + r)^30]/[(1 + r)^y - 1]
(I apologize, this equation can't be simplified any further.)
As an example, if E = 32,000, r = 4.7%, and y = 20, then
S = 32,000*[1 - 1/1.047^30]/[1.047^20 - 1]
S = 32,000*0.4967 = 15,894
Or almost double the savings amount if you start at 30 years old, or just half of the expense estimate. If you use y = 30 as in the 30-60-90 scenario, you'll actually get the original equation S = E/4.
Finally, you can also use the above formula for different saving and retirement periods. If z = the number of years of retirement, just replace "30" by z so that
S = E*[1 - 1/(1 + r)^z]/[(1 + r)^y - 1]
So if you're now 30 years old and you plan to retire by 50 and you retain the planning horizon of up to 90 years old, then y = 20 and z = 40. Using the same E and r,
S = 32,000*[1 - 1/1.047^40]/[1.047^20 - 1]
S = 32,000*0.5584 = 17,868
Remember that these estimates are only for the amount that you need to save in your first year (age 60 - y). For subsequent years, you need to adjust for inflation, like in the Part 2, but this time with a slightly different factor
Savings in Year t = (Savings in Year t)*(1 + g)^(z/y)
So that if you start saving at age 40 (y = 20), retire at 60 (z = 30), and the annual inflation rate is g = 4.5%, then
Savings at age 55: 15,894*1.045^(1.5*15) = 42,791 per month
As always, figuring out the savings amount is just the first step. To meet your target real rate of return, you should invest your retirement savings in a low-cost equity fund and only redeem your units/shares at retirement and as needed.
Savings at age 40: 15,894 per month
Savings at age 41: 15,894*(1.045^1.5) = 16,979 per month
...
As always, figuring out the savings amount is just the first step. To meet your target real rate of return, you should invest your retirement savings in a low-cost equity fund and only redeem your units/shares at retirement and as needed.
Sunday, June 9, 2013
Short Answers to Unanswered Questions: "Stocks" vs. "Equity" Funds and Comparing Investment Strategies
DEAR INVESTOR JUAN

Dear Investor Juan,
I was also second guessing myself about retirement savings. Most of my retirement funds are in stocks. I was already thinking about transferring it to BDO Equity UITF and wasn't really sure if that's the way to go. Is it?
How exactly do I do this? Since the value of stocks that I have is about 850. Do I take out 50 per month and transfer that to the UITF? and how about the monthly savings that I have? (around 35/month)
Sorry po kung maraming tanong. >_< I am just confuzzled now. I really thought that going into the stock market was the best way to earn make my money grow.
Ning
Dear Ning.
When you say that your retirement funds are mostly in stocks, how many stocks exactly? If your funds are spread across ten or more stocks, then your portfolio may already be sufficiently diversified (within the equity asset class) and you can choose to keep your funds in those stocks. To improve your portfolio's level of diversification, just invest future savings in an equity UITF.
If your funds are invested only in a handful of stocks, then you have significant exposure to unsystematic risk. To lower your risk exposure, sell some of your holdings and either invest in many other different stocks or in an equity UITF. How you do it--"one time, big time" or in installments--is arbitrary since there's no indisputable proof that "dollar cost averaging" is a superior strategy, contrary to popular opinion.
Finally, there's no reason to be "confuzzled." You're right, "going into the stock market" is arguably the best way to make your money grow. "Stocks" are the same as "equities"--investing in an equity fund is basically the same as holding a basket of individual stocks. The only difference is that if you invest in a few stocks you needlessly expose yourself to risk that can easily be eliminated with diversification. Again, I emphasize that for retirement savings, investing in a low-cost equity fund in the long term (20 to 30 years) is the way to go.
***
Dear Investor Juan,
Thank you very much for a very informative blog.
I started investing only last year with a reputable global insurance company, so what i have is an insurance link investment. lately, i have been hearing a lot about mf and uitf, and my curiosity is awakened. thanks for blogs like yours and tv shows which explain everything, i now understand the pros and cons of these better.
I have been trying to do a mock computation of yields through bdo online, and i noticed that if i put my money, say 500k, from Jan. 2 - May 31, 2013 (method a), my gain would be more or less 68k. but, if i invest from Jan. for 30 days (method b), take it out, then reinvest it again for another 30 days, and so on until May 31, my gain would be about 82k.
what is your take on that?
thank you so much. may God bless you in your advocacy. more power!
Anonymous
Dear Anonymous,
I'm not sure where the problem is, but you should earn the same returns with the two strategies since in Method B, whenever you reenter the fund you would be buying at the same NAVPU as when you last exited. Actually, if you're talking about an equity fund, then you should earn less with Method B because of early redemption charges.

Dear Investor Juan,
I was also second guessing myself about retirement savings. Most of my retirement funds are in stocks. I was already thinking about transferring it to BDO Equity UITF and wasn't really sure if that's the way to go. Is it?
How exactly do I do this? Since the value of stocks that I have is about 850. Do I take out 50 per month and transfer that to the UITF? and how about the monthly savings that I have? (around 35/month)
Sorry po kung maraming tanong. >_< I am just confuzzled now. I really thought that going into the stock market was the best way to earn make my money grow.
Ning
Dear Ning.
When you say that your retirement funds are mostly in stocks, how many stocks exactly? If your funds are spread across ten or more stocks, then your portfolio may already be sufficiently diversified (within the equity asset class) and you can choose to keep your funds in those stocks. To improve your portfolio's level of diversification, just invest future savings in an equity UITF.
If your funds are invested only in a handful of stocks, then you have significant exposure to unsystematic risk. To lower your risk exposure, sell some of your holdings and either invest in many other different stocks or in an equity UITF. How you do it--"one time, big time" or in installments--is arbitrary since there's no indisputable proof that "dollar cost averaging" is a superior strategy, contrary to popular opinion.
Finally, there's no reason to be "confuzzled." You're right, "going into the stock market" is arguably the best way to make your money grow. "Stocks" are the same as "equities"--investing in an equity fund is basically the same as holding a basket of individual stocks. The only difference is that if you invest in a few stocks you needlessly expose yourself to risk that can easily be eliminated with diversification. Again, I emphasize that for retirement savings, investing in a low-cost equity fund in the long term (20 to 30 years) is the way to go.
***
Dear Investor Juan,
Thank you very much for a very informative blog.
I started investing only last year with a reputable global insurance company, so what i have is an insurance link investment. lately, i have been hearing a lot about mf and uitf, and my curiosity is awakened. thanks for blogs like yours and tv shows which explain everything, i now understand the pros and cons of these better.
I have been trying to do a mock computation of yields through bdo online, and i noticed that if i put my money, say 500k, from Jan. 2 - May 31, 2013 (method a), my gain would be more or less 68k. but, if i invest from Jan. for 30 days (method b), take it out, then reinvest it again for another 30 days, and so on until May 31, my gain would be about 82k.
what is your take on that?
thank you so much. may God bless you in your advocacy. more power!
Anonymous
Dear Anonymous,
I'm not sure where the problem is, but you should earn the same returns with the two strategies since in Method B, whenever you reenter the fund you would be buying at the same NAVPU as when you last exited. Actually, if you're talking about an equity fund, then you should earn less with Method B because of early redemption charges.
Wednesday, June 5, 2013
The 30-60-90 Approach to Retirement Planning, Part 2: Considering Inflation and Investment Returns

According to the "30-60-90" approach to retirement planning, since the time it takes to accumulate funds for retirement and the retirement period are both 30 years, the amount that you save in any given month or year will finance your retirement expenses in 30 years. In this post, we'll discuss a simple way to estimate how much you need to save today to be able to finance what you intend to spend in 30 years considering the effects of inflation and investment returns.
Let's say that you estimate that on any given month, you'll need 32,000 pesos at today's prices to support your chosen lifestyle. If we consider inflation, then you have to save more than 32,000 this month so that in 30 years, you'll be able to buy what 32,000 can buy today (maybe you should read this phrase one more time, it can be confusing)--but how much more? The inflation rate is the percent increase in the prices of basic goods and services every year. Specifically, if the price a good or service at time t is Price(t) and the average annual inflation rate is g, then the price of the good after n years is
Price(t + n) = Price(t)*(1 + g)^n
(I hope you're not turned off by the math. Honestly, using a bit of math is unavoidable in practical financial management. I always try to make technical discussions as simple as possible, so I hope you'll bear with me.)
For example, let's say that today, or t = 0, 32,000 pesos, or Price(0), can buy a certain amount of goods and services. In 30 years, or n = 30, how much money do you need to be able to buy the same amount of goods and services if the average annual inflation rate, g, is 4.5%? Using the above equation,
Price(30) = 32,000*(1.045)^30 = 119,850
Which means that 32,000 today will be able to buy as much stuff as 119,850 in 30 years. Does this mean you have to save 119,850 today in order to to finance your target lifestyle? Well, yes, if you plan on keeping your savings in a piggy bank or under the mattress--if your retirement savings will earn zero or very little interest. But if you keep your retirement savings in an interest-earning vehicle, you won't have to save as much. In fact, if you invest in vehicles that provide returns that beat inflation, then you can even save an amount that is less than your target expense. But how much less?
To take investment returns and the time value of money into account, we need to use the present value concept. If you need an amount Price(t + n) in n years and invest your savings at time t in an instrument that earns a rate of return i per year, then the amount that you have to save and invest at time t is
Savings(t) = [Price(t + n)]/[(1 + i)^n]
Using the same example above, in order to accumulate 119,850 in 30 years by investing in an instrument that earns an average annual return of 7%, then you have to save
Savings(0) = 119,850/[(1.07)^30] = 15,744
Less than half of our original retirement expense estimate of 32,000.
Taking inflation and investment returns simultaneously by combining the two equations above, we get
Savings(t) = [Expenses(t)*(1 + g)^n]/[(1 + i)^n] = [Expense(t)]*[(1 + g)^n]/[(1 + i)^n]
Where "Expenses(t)" is the estimated monthly or annual expense at time t. With the 30-60-90 approach, t = 0 and n = 30, so
Savings = Expenses*[(1 + g)/(1 + i)]^30
This equation shows that if your annual investment return is the same as the inflation rate, or i = g, then Savings = Expenses, or you have to save an amount equal to your projected future expense at today's prices (32,000 in the example above). If you invest such that i > g, like in the above example, then your savings requirement will be less than your estimated expenses (e.g., 15,744 vs. 32,000). Finally and most importantly, if your annual investment return is less than the inflation rate, such as if you invest in savings deposits, time deposits, or not at all, then you would need to save more than your estimated periodic expenses.
(1 + i)/(1 + g) is a special quantity in finance and economics that is referred to as the real rate of return on investments, for which we'll henceforth use the symbol r. It is the rate of return of an investment at constant prices, or at g = 0. Approximately, r = i - g, so that
To check, at i = 7% and g = 4.5%, r = 2.5%. If your target monthly expense is 32,000, then Savings = 32,000/(1.025)^30 = 15,256. Not exactly the same as the earlier result of 15,744, but close enough for all intents and purposes.
This last equation shows that as long as you invest your retirement savings in an instrument with a consistently positive real rate of return, then you can save an amount that is less than your estimated retirement expenses. But which instrument can reliably provide a positive real rate of return? Low-cost equity funds, particularly in long-term horizons such as 30 years. I'll discuss this in more detail in a future post, but if you want to look into it now, I suggest reading Jeremy Siegel's Stocks for the Long Run.
Savings = Expenses/(1 + r)^30
To check, at i = 7% and g = 4.5%, r = 2.5%. If your target monthly expense is 32,000, then Savings = 32,000/(1.025)^30 = 15,256. Not exactly the same as the earlier result of 15,744, but close enough for all intents and purposes.
This last equation shows that as long as you invest your retirement savings in an instrument with a consistently positive real rate of return, then you can save an amount that is less than your estimated retirement expenses. But which instrument can reliably provide a positive real rate of return? Low-cost equity funds, particularly in long-term horizons such as 30 years. I'll discuss this in more detail in a future post, but if you want to look into it now, I suggest reading Jeremy Siegel's Stocks for the Long Run.
In the Philippines, the average annual inflation rate in the past decade is 4.5% and the average one-year change in the PSEi from 1994 to 2013 is around 8.5%. Assuming a PSEi dividend yield of 2%, the average annual return of the market is 10.5%, resulting in an average real rate of return r of 6% per year. For a conservatism, however, we can use a lower estimate for r, such as 5%.
Savings = Expenses/(1.05)^30
Savings = Expenses/4.3
Savings = Expenses/4.3
For further simplification, you may want to round the divisor to 4, which is equivalent to r = 4.7%.
Savings = Expenses/4
To summarize, using the 30-60-90 approach and assuming that the average real rate of return of an equity fund is 4.7%, you need to save an amount equal to your estimated expenses divided by 4. It does not end here, though, because in order to realize your estimated real returns, you have to religiously invest your retirement savings in a low cost equity fund and withdraw no earlier than 30 years after.
Finally, I must clarify that the savings amount given by "Savings = Expenses/4" is only for the first month or period of the earning period, or at age 30 in the 30-60-90 framework. In the succeeding years, the savings amount must be adjusted by the annual inflation rate.
For example, if Expenses = 32,000 per month, then
Savings at age 30: 32,000/4 = 8,000 per month
Savings at age 31: 8,000*1.045 = 8,360 per month
...
Savings at age 55: 8,000*1.045^25 = 24,043 per month
But what if your situation does not adequately fit the 30-60-90 scenario, like if you're just starting to save for retirement at age 40? In a follow-up post, I'll show how you can adjust the savings formula to better reflect your situation.
***
EDIT: 2 July, 2013
I checked my numbers again, and the average one-year change in the PSEi from 1994 to 2013 that I got was 8.6%, not 12%. I will make the necessary changes in the above discussion to reflect this difference.
Thursday, May 30, 2013
Add-on Rates Revisited
DEAR INVESTOR JUAN
Dear Investor Juan,
I just got a loan for 450k 36months to pay.. I see a per annum rate of 28.58% but she was saying something about 1.29% per month add on rate.. Im confused, mind explaining it to me the add on rate?
Thanks,
Mon
Dear Mon,
I have already discussed the difference between add-on rate and the monthly compounded interest rate (such as in credit card debt or home and car loans) in this post, but I will try to explain in again and apply it to your situation.
With add-on interest, the quoted monthly add-on interest rate is multiplied to the principal or loan amount to get the monthly interest payment. For the monthly principal repayment, the loan amount is divided by the loan duration. In your case, therefore, the monthly interest payment is 1.29%*450,000 = 5,805, while the monthly principal repayment is 450,000/36 = 12,500, and the total monthly payment is 5,805 + 12,500 = 18,305, an amount that you would have to pay every month, as seen in the spreadsheet below. If you scroll down to the bottom of the sheet, you'll see that at the end of 36 months, you will have paid a total of 658,980, of which 208,980 is for interest. Further down, you'll see that the internal rate of return or IRR, a way to compute for return or interest while considering the timing of payments, is 26.72%. This is not exactly what your bank representative quoted, but this may be what she was talking about.
Now if we were to take the same monthly interest rate of 1.29% but this time apply it as a monthly compounded rate in an amortized loan, then we'll see a different payment schedule. Please refer to the spreadsheet below.
To get the monthly payment (or "amortization") of this kind of loan, we have to use the PMT function of Excel or any spreadsheet program, where "rate" = 1.29%, "nper" = 36, and PV = -450,000. The resulting figure is 15,705, which is the amount that is paid every month until the 36th month. In the first payment, 1.29%*450,000 = 5,805 goes to interest, same as in the add-on loan, so 15,705 - 5,805 = 9,900 goes to principal. The following month, the principal goes down to 450,000 - 9,900 = 440,100, which will then become the basis for this month's interest payment of 440,100*1.29% = 5,677. Do you now see how this kind of loan is different from your add-on loan?
With monthly compounded interest loans, principal repayments are deducted from the principal, the lower principal balance becomes the basis for interest computation, and interest payments decline (and in the case of amortized loans where the monthly payment is constant, principal payments increase) as the end of the loan period nears. With add-on interest, monthly interest payments stay the same even as part of the principal is repaid every month. And this is why, at the same "monthly interest rate," add-on interest loans are more expensive than monthly compounded debt.
I hope I was able to explain the add-on rate sufficiently, Mon. Good luck.
Monday, May 27, 2013
Concerns about Early Retirement
DEAR INVESTOR JUAN
Dear Investor Juan,
I've been reading your blog and I find it entertaining and at the same time educational. I have a few questions for you but let me give you a little background about myself. I am 27 years old and single. Been working as a caregiver and my goal is to quit work by next year and follow my long time dream of becoming a lay missionary. I wasn't able to follow my dream coz my family needed me financially and now that I settled them already, it's time for me to follow my heart's desire.
Let me give you and idea on my financial life and please tell me if you think I can follow my goal or if I should extend a year or two before quitting work for good.
Net worth: Php 4 Million
Mutual fund : Php 150k
Stocks: Php 1M
Debt : 0
Other investments : Small land
Home: owned
I am a frugal person and live simply. I am also a minimalist and I don't dabble in consumerism. I'm planning on not touching my paper assets till I'm old. I also have emergency fund worth 6 months of living expenses. However, I don't have insurance and would like to avail one. Please take note that I'm single and with no beneficiary.
You think it's possible to quit work and "forget" about my paper assets and just move on with life without adding to it? How much you think my money would grow in 40 years considering inflation? I'm still investing 70-80 percent of my income as of the moment. How am I doing financially. I am a voluntary celibate and don't plan on marrying in the future so please consider that too esp with health care cost with no one to share the expenses when I'm old.
Sorry if I have tons of questions. I just needed some advice on where I stand financially or if I can quit work by next year coz I feel so empty. I keep thinking if next year is the time where I can say to myself that " My earning days are over. Time for me to follow my dream"
Good luck and thanks so much,
Cory
(Additional information in response to a follow-up email.)
4 million consist of emergency fund, mutual fund, stocks and the townhouse in Cebu (subdivision) which actually appraised at 1.3M and its in use (that's where I will live once I get home). My other land is totally small and idle that I did not count it in my asset. I consider my townhouse an asset, though.
My expected expenses is P15k (scrimp) - P25k (splurge). I'm totally used to simple life and would like to live frugally. I am planning to live on my townhouse that I own when I grow old which is situated in Mactan, Cebu or I'll probably move somewhere quiet depending on the cost of living as long as its safe. I'm not maarte :) (Emphasis is mine. - IJ)
Thanks a bunch.
Cory
Dear Cory,
Choosing to retire early compounds the "retirement problem" because the longer retirement period increases funding requirement, and at the same time, the smaller earning window makes it harder to meet the higher retirement fund target. It's still possible, though, if one starts saving early enough and earns (and saves) high enough. And from the information you've provided, I think you meet both criteria to a certain degree, we just have to see if you meet the criteria well enough.
It's time to crunch some numbers (since we can't really use the 30-60-90 framework that I introduced a couple of posts back).
Let's start by assuming that your assets will earn just enough returns to be able to beat inflation so that the spending power of your assets is constant throughout the planning horizon. Speaking of planning horizons, the typical end-of-horizon age planners use is 90 years, so let's start with that.
Retirement period = 90 - 28 = 62 years * 12 = 744 months.
Net worth = 4,000,000/744 months = 5,376 pesos per month. Can you live on this amount?
Honestly, 90 years may be a bit conservative since it's well above the estimated life expectancy of Filipinos (or people living in the Philippines?) of around 68 years. If we use 80 years, we get:
Retirement period = 80 - 28 = 52 years * 12 = 624 months.
Net worth = 4,000,000/624 months = 6,410 pesos per month. Better, but maybe still not enough.
Things don't look so good given the above assumptions. But if you subscribe to the concept of long-term passive investing, something like Jeremy Siegel's "stocks for the long run" argument (to which I completely adhere, but that's for another post), then the returns on your assets should be able to reliably beat inflation year-on-year and give your assets more spending power. The question is: how much more?
Please consider the timeline at the top of the image above. Say you withdraw an amount X from your assets for your expenses on your first year of retirement. The following year, you withdraw a higher amount, X*(1+g), where g is the average annual inflation rate. You keep on doing this until age 89, where you withdraw an amount equal to X*(1+g)^61.
The sum of your withdrawals should of course be less than or equal to your total net worth of 4 million plus your investment returns, if your assets earn annual average return of i. Then, what would be the largest value of X given that you have 4 million in assets today, your assets can earn an annual return of i, and annual inflation is g? There are several approaches in solving for X, but the most straightforward is to get the present value of the withdrawals and equate it to 4 million using the formula:

The average annual inflation rate in the Philippines in the past 10 years is around 4.5% (I thought it would be lower for outside the NCR, but it's not. This figure is for the entire country), so let's use that for g. Let's assume that you'll invest your assets in a diversified portfolio of stocks such that you'll earn the average annual return of the PSEi. I don't have exact numbers at the moment, so let's just use i = 7%, which I believe is a conservative estimate (given that the S&P 500 has had an annualized return of close to 10% in the past 25 years). Solving for X as shown in the image above, we get:
@ g = 4.5%, i = 7%, X = 122,394 or 10,200 per month. More workable?
Of course, higher assumptions for i would further improve the situation.
@ g = 4.5%, i = 8%, X = 149,695 or 12,475 per month
@ g = 4.5%, i = 9%, X = 178,797 or 14,900 per month
You'll notice that this last estimate almost meets your "scrimp" budget, so I think your plan is workable. To make it really work, though, you would have to keep most of your assets in equities so that you'll have a higher chance of beating inflation every year, and beating it by a higher amount. Also, I still strongly encourage you to stick to the DRREW plan--particularly, always have some amount ready for unexpected expenses and get some form of private health insurance.
Finally, you may want to delay retirement for a few years and maybe build up your funds to 5 or 6 million. Try to play with the equation, change 4 million to a higher amount and instead of 60 change the exponent to years of retirement - 1, and see by how much X will increase.
Dear Investor Juan,
I've been reading your blog and I find it entertaining and at the same time educational. I have a few questions for you but let me give you a little background about myself. I am 27 years old and single. Been working as a caregiver and my goal is to quit work by next year and follow my long time dream of becoming a lay missionary. I wasn't able to follow my dream coz my family needed me financially and now that I settled them already, it's time for me to follow my heart's desire.
Let me give you and idea on my financial life and please tell me if you think I can follow my goal or if I should extend a year or two before quitting work for good.
Net worth: Php 4 Million
Mutual fund : Php 150k
Stocks: Php 1M
Debt : 0
Other investments : Small land
Home: owned
I am a frugal person and live simply. I am also a minimalist and I don't dabble in consumerism. I'm planning on not touching my paper assets till I'm old. I also have emergency fund worth 6 months of living expenses. However, I don't have insurance and would like to avail one. Please take note that I'm single and with no beneficiary.
You think it's possible to quit work and "forget" about my paper assets and just move on with life without adding to it? How much you think my money would grow in 40 years considering inflation? I'm still investing 70-80 percent of my income as of the moment. How am I doing financially. I am a voluntary celibate and don't plan on marrying in the future so please consider that too esp with health care cost with no one to share the expenses when I'm old.
Sorry if I have tons of questions. I just needed some advice on where I stand financially or if I can quit work by next year coz I feel so empty. I keep thinking if next year is the time where I can say to myself that " My earning days are over. Time for me to follow my dream"
Good luck and thanks so much,
Cory
(Additional information in response to a follow-up email.)
4 million consist of emergency fund, mutual fund, stocks and the townhouse in Cebu (subdivision) which actually appraised at 1.3M and its in use (that's where I will live once I get home). My other land is totally small and idle that I did not count it in my asset. I consider my townhouse an asset, though.
My expected expenses is P15k (scrimp) - P25k (splurge). I'm totally used to simple life and would like to live frugally. I am planning to live on my townhouse that I own when I grow old which is situated in Mactan, Cebu or I'll probably move somewhere quiet depending on the cost of living as long as its safe. I'm not maarte :) (Emphasis is mine. - IJ)
Thanks a bunch.
Cory
Dear Cory,
Choosing to retire early compounds the "retirement problem" because the longer retirement period increases funding requirement, and at the same time, the smaller earning window makes it harder to meet the higher retirement fund target. It's still possible, though, if one starts saving early enough and earns (and saves) high enough. And from the information you've provided, I think you meet both criteria to a certain degree, we just have to see if you meet the criteria well enough.
It's time to crunch some numbers (since we can't really use the 30-60-90 framework that I introduced a couple of posts back).
Let's start by assuming that your assets will earn just enough returns to be able to beat inflation so that the spending power of your assets is constant throughout the planning horizon. Speaking of planning horizons, the typical end-of-horizon age planners use is 90 years, so let's start with that.
Retirement period = 90 - 28 = 62 years * 12 = 744 months.
Net worth = 4,000,000/744 months = 5,376 pesos per month. Can you live on this amount?
Honestly, 90 years may be a bit conservative since it's well above the estimated life expectancy of Filipinos (or people living in the Philippines?) of around 68 years. If we use 80 years, we get:
Retirement period = 80 - 28 = 52 years * 12 = 624 months.
Net worth = 4,000,000/624 months = 6,410 pesos per month. Better, but maybe still not enough.
Things don't look so good given the above assumptions. But if you subscribe to the concept of long-term passive investing, something like Jeremy Siegel's "stocks for the long run" argument (to which I completely adhere, but that's for another post), then the returns on your assets should be able to reliably beat inflation year-on-year and give your assets more spending power. The question is: how much more?
 |
| Click to enlarge |
Please consider the timeline at the top of the image above. Say you withdraw an amount X from your assets for your expenses on your first year of retirement. The following year, you withdraw a higher amount, X*(1+g), where g is the average annual inflation rate. You keep on doing this until age 89, where you withdraw an amount equal to X*(1+g)^61.
The sum of your withdrawals should of course be less than or equal to your total net worth of 4 million plus your investment returns, if your assets earn annual average return of i. Then, what would be the largest value of X given that you have 4 million in assets today, your assets can earn an annual return of i, and annual inflation is g? There are several approaches in solving for X, but the most straightforward is to get the present value of the withdrawals and equate it to 4 million using the formula:
The final equation is boxed in the image above.
The average annual inflation rate in the Philippines in the past 10 years is around 4.5% (I thought it would be lower for outside the NCR, but it's not. This figure is for the entire country), so let's use that for g. Let's assume that you'll invest your assets in a diversified portfolio of stocks such that you'll earn the average annual return of the PSEi. I don't have exact numbers at the moment, so let's just use i = 7%, which I believe is a conservative estimate (given that the S&P 500 has had an annualized return of close to 10% in the past 25 years). Solving for X as shown in the image above, we get:
@ g = 4.5%, i = 7%, X = 122,394 or 10,200 per month. More workable?
Of course, higher assumptions for i would further improve the situation.
@ g = 4.5%, i = 8%, X = 149,695 or 12,475 per month
@ g = 4.5%, i = 9%, X = 178,797 or 14,900 per month
You'll notice that this last estimate almost meets your "scrimp" budget, so I think your plan is workable. To make it really work, though, you would have to keep most of your assets in equities so that you'll have a higher chance of beating inflation every year, and beating it by a higher amount. Also, I still strongly encourage you to stick to the DRREW plan--particularly, always have some amount ready for unexpected expenses and get some form of private health insurance.
Finally, you may want to delay retirement for a few years and maybe build up your funds to 5 or 6 million. Try to play with the equation, change 4 million to a higher amount and instead of 60 change the exponent to years of retirement - 1, and see by how much X will increase.
Thursday, May 23, 2013
The 2013 Philippine Senatorial Elections: A Lesson in Statistics and Framing
I was supposed to finish the draft of my dissertation this afternoon but something more important came up.
This morning, while I was busy watching Game 1 of the Heat-Pacers series (coach Vogel, why did you take Hibbert out in the last couple of plays?) while doing laundry, a wild news article appeared:
Ateneo prof's 60-30-10 poll results pattern gets Comelec's attention
The article talks about Ateneo de Manila Associate Professor Lex Muga and his observation of an "interesting" pattern in the polling of partial results in the last Senatorial elections. And if one takes a look at his recent public Facebook posts on the matter, one will see the following graphics.


While Dr. Muga does not explicitly say anything in his Facebook posts, the article above managed to elicit his more exact thoughts on the matter:
“May pattern. Interesting pattern. Sabi ko nga na parang 60-30-10. Ang tanong ko, bakit ‘pag kunin mo ‘yung mga actual votes sa first canvass, second canvass, kuha sila mula sa isang probinsiya lang bakit 60-30-10 pa rin? Hanggang 16. ‘Di ba manggagaling naman sa iba-ibang probinsiya ang COCs (certificates of canvass) eh? So baka ‘di dapat ganun. Dapat merong variation," Muga said in an interview aired on GMA News' "24 Oras." (Emphasis is mine. - IJ)
In English, "there should be variation in the data," which implies that Dr. Muga sees no variation and that the "60-30-10" pattern is the same across all 16 canvas results.
This is where things turn for the wrong.
One thing that you'll notice in Dr. Muga's statistics and graphics is that there is no mention of sample size, or how large the data set involved is--and inadvertent or not, this is a critical omission. Yes, to the naked eye, the numbers seem to form a pattern. Yes, when our minds look at the data, there don't seem do be any significant differences in the proportion of votes for each coalition from canvas to canvas. However, the problem is that our eyes and minds are not always capable of seeing or comprehending differences that matter. Any student of elementary statistics should know that even seemingly small or immaterial differences matter if the sample is big enough.
All the tools that we need are available to see if there is indeed a statistically significant pattern of constancy in the data. The data that Dr. Muga used is here. And you can follow the results of my analysis with this Excel file.
Some clarifications before we start:
- What are we trying to prove or disprove? That the pattern that Dr. Muga has observed exists, that the proportion of votes that went to each political coalition is constant from canvas to canvas.
- For the sake of expediency, we will just focus on the proportion of votes for Team PNoy candidates.
- We will use the incremental increases in votes from canvas to canvas. Seriously, it's idiotic to use the cumulative totals: of course it's going to converge to the population average, the denominator keeps on getting bigger and approaching the total number of senator-votes.
- Since each voter can vote for 12 senators, then the appropriate unit of analysis is the senator-vote, where each voter has a maximum of 12 senator-votes. The number of "votes" in the spreadsheet or results are therefore not the same as the number of voters, but rather the number of senator-votes.
Test 1: Comparing confidence intervals
A confidence interval is an interval estimate for a number that we don't know the true value of. For example, if the 95% confidence interval for the proportion of votes that went to Team PNoy is 59% to 61% (or [59%,61%]), then we can say that there is a 95% chance that the true proportion is between 59% and 61%. Why do I use the qualifier "true"? The true proportion is not exactly known because we don't have the complete results yet; each canvas tabulation is just a representative sample of the total population of senator-votes.
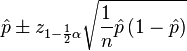
In the "PNoy" tab, I have computed for the confidence interval for each sample (i.e., canvas result) using the formula below at the significance levels 0.05 and 0.01 (significance levels basically measure how much room for error you are willing to accept).
Confidence intervals make comparing two estimates easier. Basically, if the confidence intervals for two estimates overlap, then they are statistically equal. BUT if the confidence intervals don't overlap, then there is enough statistical evidence that the estimates are not equal.
In the "PNoy Confidence Intervals" and "PNoy Confidence Intervals (2)" tabs, I have compared the confidence intervals of the proportion estimates for each canvas using significance levels of 0.05 and 0.01, respectively. Both results show that out of 120 confidence interval pairs, only 3 overlap (3 vs. 14, 9 vs. 10, and 6 vs. 8). This means that up to a 1% significance level, 117 out of 120 pairs are statistically different! This method therefore rejects the hypothesis that there is no variation in the data, or that the proportion of votes for Team PNoy is the same from canvas to canvas. Almost all of the proportions are statistically different!
Test 2: Chi-square goodness of fit test
We can use this test for the hypothesis "the proportion of votes that went to each political coalition is constant from canvas to canvas" in one step. The proportion of the total number of votes up to the 16th canvas is 59.63%. If we assume that the same proportion of incremental votes in each canvas voted for Team PNoy, then the coalition should get the expected number of votes E per canvas, as shown in the "Chi Square" tab.
The Chi square statistic is given by
If the statistic is big enough, it means that the set of observed or actual votes (O) for Team PNoy is statistically different from the set of expected votes (E), and the hypothesis is rejected.
The resulting Chi square statistic is 50,000+, which is more than enough to reject the hypothesis. Again, the data shows that the proportion of votes for Team PNoy is statistically different from canvas to canvas.
Test 3: The "Random Coalition" eyeball test
There are plenty of things in statistics (or in the entire universe, actually) that are counter-intuitive or are hard to understand.
Take this last "test," for example. Choose any 9 senatorial candidate at random from the list of 33. I used my calculator's "Ran#" to draft my "dream team" of random senatoriables:
 |
| Please click to enlarge. |
Plotting the percentages using the same axis as Dr. Muga, we get:

What wizardry is this? A similar pattern for a random group of candidates?
We also have to remember, however, that a lot of times, things are not as simple or straightforward as they look. The same data using a different vertical axis:

Replication of graph for Team PNoy proportion of votes that Dr. Muga posted in Facebook:

Same data, using a different vertical axis.

*Sigh*
I'm sure a lot of shenanigans happened in the last elections. There's one more thing that I'm sure of, though: whatever happened is not reflected by the data, and that the "interesting" pattern that Dr. Muga observed does not really exist.
Just remember two things: 1) the sample size matters; and 2) framing matters.
For those who missed it, the Excel file that contains all the data and analysis is here.
Subscribe to:
Posts (Atom)