Showing posts with label Fundamental Analysis. Show all posts

Thursday, April 19, 2012

Making Forecasts with Linear Regression, Part 2

PERSONAL FINANCE 101

In Part 1, I identified my goal to estimate when Investor Juan will earn 50,000 monthly pageviews given 20 months of historical data. I also discussed the basic premise of linear regression forecasting and how it's only applicable to data which displays a linear trend. In this post, I will proceed by discussing how to define the trend line and how to use this to make forecasts.

Step 2: Estimate the "best fit line"

In linear regression, we identify the general linear trend of the data by fitting a straight line to the data points--the best fit line.
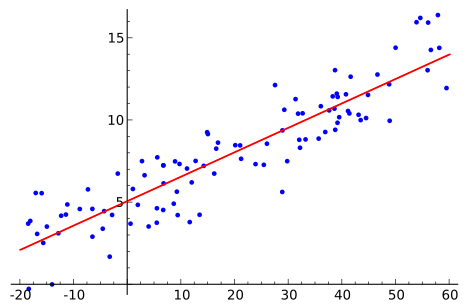

In high school, I remember doing this with our physics experiment results mechanically--as in taking a straight rule to find a straight line that touches most of the plotted points. The problem with this technique is that different people will get different lines given the same data since the qualifier "best fit" becomes a matter of personal judgment. In statistics, there is a way to find the best fit line objectively and mathematically: the method of ordinary least squares finds a line such that the sum of the squared distances of the data points to the line is minimum. The result is a unique straight line defined by two parameters a and b, such that

y = a + bx

where y is the dependent variable (e.g., pageviews), x is the independent variable (e.g., month), and a is the y-intercept and b the slope of the best fit line. Computing for a and b can be quite troublesome when done by calculator (to which my past statistics students will attest); fortunately, spreadsheet programs like Excel and Google Spreadsheets have features and functions that can easily solve for these parameters.

For Google Spreadsheets, we can use the INTERCEPT and SLOPE functions to get a and b, respectively. For example, using the SLOPE function, we enter the data this way (I find it easier to use reference values for "month" instead of the actual months):


Following the same procedure for the INTERCEPT function, we get the following parameters for our best fit line

a = 929, b = 792 (rounded to the nearest whole number)

resulting in the best fit line or linear regression equation

y = 929 + 792x

What do these numbers mean? a = 929, the y-intercept, is the interpolated number of pageviews when x = 0, which is on August 2010. Meanwhile b = 792, the slope, is just the predicted number of additional page views per month. Now that we know where we started (y-intercept) and by how much we change per month (slope), forecasting future pageviews is easy peasy.

Step 3: Use the linear regression equation to make forecasts

Let's say we want to forecast the monthly page views in April 2013, or 12 months from now, we just enter x = 32 (which is 20 + 12) into the equation and compute for y. We get y = 26,273 pageviews in April 2013. 

For the objective that we defined at the beginning of this exercise, we do things a bit differently. Instead of the number of pageviews y, we want to know x when y is 50,000. In equation form, this is

50,000 = 929 + 792x

Solving for x, we get x = 61.96 ~ 62, or 42 months or 3 and a half years from now. That's October 2015; let's see how good our forecast is then. ;)

There you have it, a brief introduction to forecasting with linear regression. I'm sure you can find better uses for it than projecting pageviews of an obscure personal finance blog, hahaha.

Tuesday, April 17, 2012

Making Forecasts with Linear Regression, Part 1

PERSONAL FINANCE 101

The tricky thing about investing is that we don't know what's going to happen in the future--if we did then we'd all be millionaires (is this actually true? bonus points to anyone who can tell me why it is not). This is why forecasting is one of the most critical--although, unfortunately, often also the most mishandled--aspects of business and financial management. For example, almost all of an enterprise's processes--budgeting, strategic planning, operations, marketing, financial management--heavily rely on a well-thought out sales forecast. Also, when people talk about stock price movements we almost always hear the phrase "earnings projections" mentioned in the same breath because essentially, the price or worth of a stock or any asset is just a measure of how much cash flows it can generate in the future.

There are perhaps a million ways to forecast something, ranging from the mundane (e.g., applying the latest growth rate to this year's numbers) to the esoteric (e.g., autoregressive integrated moving average models). What I'll discuss in this post falls somewhere in between: forecasting with linear regression is simple enough that it can be easily performed with spreadsheet programs and powerful enough that it can be pretty reliable given the right data set. Unfortunately, linear regression is not enough for what most of you are actually itching to do: forecast stock prices. If you really want to do that, you might want to learn the "esoteric" method that I mentioned above.

Throughout this post, to be fair to those who have managed to exorcise Microsoft out of their lives, I will be using Google Spreadsheets.

Step 0. What are you trying to forecast?

I will try to use linear regression to answer a very relevant and timely question: when will Investor Juan reach 50,000 monthly pageviews?

Step 1. Take a look at the data--literally!

The basic premise of linear regression forecasting is that the data follow a trend that somewhat resembles a straight line and that there's reason to believe that this linear trend will persist in the foreseeable future. This premise implies two requirements. First, that there is enough data to be able to clearly distinguish a trend. In this example, I will use Investor Juan's pageviews in the past 20 months.

Second, the data should exhibit a clear linear trend, even if the trend is not perfectly linear (as is always the case). Regression analysis, in general, evaluates the possible linear relationship between two variables--an independent variable and a dependent variable; in using linear regression for forecasting, we just use "time" as the independent variable. Therefore, before we process the numbers, we need to first plot the data (using a "scatter" plot or graph) to "see" whether two variables have a somewhat linear relationship.

For example, from the graph below, it's easy to see that the two variables have a positive linear relationship; the plot shows that in general, high grip strength is associated with high arm strength, and vice versa (notice that I just said "associated with" and not "caused by"; that's an important limitation of regression analysis--it can only show correlation but not causation).


In this second example, the relationship is not so clear. While we can still use regression analysis to derive a line that best describes the relationship, the result will not be meaningful.


So would our data pass this inspection "test"? If you use create a scatter plot using the pageview data I provided above, you'll see that monthly pageviews--our dependent variable of interest--seems to increase in a linear fashion over time, making linear regression an appropriate tool for forecasting.


In Part 2, I will continue the procedure by identifying and defining the linear trend using Google Spreadsheets functions and using the results to forecast.

Monday, March 19, 2012

Performing Industry Analysis with Porter's Five Forces

According to business strategy expert Michael Porter, "the essence of formulating competitive strategy is relating a company to its environment." The state of competition in an industry depends on five basic competitive "forces": the threat of new entrants, bargaining power of suppliers, bargaining power of buyers, threat of substitute products or services, and rivalry among existing firms. The goal of competitive strategy for a business unit is to find a position in the industry where the company can best defend itself against these competitive forces or can influence these forces in its favor. Porter's "Five Forces" framework is also widely used in evaluating the attractiveness or suitability of an industry for investment or entry, or the competitive standing of a particular player within an industry.


Threat of new entrants

New entrants inject substantial resources and bring new capacity to an industry, thus increasing competition and placing additional pressure on profitability among all players. The threat posed by new entrants primarily depends on the barriers to entry that are present: the higher the barriers to entry, the lower the threat from new entrants. Major barriers to entry include economies of scale, product differentiation (brand identification and customer loyalties), capital requirements, switching costs, access to distribution channels, and cost disadvantages independent of scale (proprietary product technology, favorable access to raw materials, favorable locations, government subsidies, learning or experience curve, etc.), and government policy. Also, if existing competitors respond forcefully to make the entrant’s stay an unpleasant one, the entry may well be deterred: specifically, the threat of entry into an industry can be eliminated if incumbent firms price products and services low enough

Bargaining power of suppliers

Suppliers can exert bargaining power over participants in an industry by threatening to raise prices or reduce the quality of purchased goods and services.

A supplier group is powerful if: it is dominated by a few companies; it is not obliged to contend with other substitute products for sale to the industry; the industry is not an important customer of the supplier group; the suppliers’ product is an important input to the buyer’s business; the supplier group’s products are differentiated or it has built up switching costs; and finally, the supplier group poses a credible threat of forward integration.

A firm can improve its situation through strategies such as enhancing its threat of backward integration or eliminating switching costs.

Bargaining power of buyers

Buyers compete with the industry by forcing down prices, bargaining for higher quality or more services, and playing competitors against each other--all at the expense of industry profitability.

A buyer group is powerful if: it is concentrated or purchases large volumes relative to seller sales; the product it purchases from the industry represents a significant fraction of the buyer’s costs or purchases; the products it purchases from the industry are standard or undifferentiated; it faces few switching costs; it earns low profits, and hence is highly price sensitive and less loyal to a firm; the buyers pose a credible threat of backward integration and can therefore demand bargaining concessions; the industry’s product is unimportant to the quality of the buyer’s products or services; the buyer is well informed; and lastly, the buyer can influence other buyer’s purchasing decisions.

A company can improve its strategic posture by finding buyers who posses the least power to influence their profitability adversely.

Threat of substitute products or services

Substitutes limit the potential returns of an industry by placing a ceiling on the prices firms in the industry can profitable charge. Substitutes not only limit profits in normal times but these can also reduce the rewards an industry can reap in boom times.

Identifying substitute products is a matter of searching for other products that can perform the same function as the product of the industry. Substitute products that deserve the most attention are those that are subject to trends improving their price-performance tradeoff with the industry’s product, or are produced by industries earning higher profits.


Rivalry among existing competitors

Rivalry among existing competitors takes the familiar form of "jockeying for position" or performing actions that aim to improve a player's competitive position in the industry--using tactics like price competition, advertising battles, product introductions, and increased customer service and warranties. This occurs because one or more competitors feel the pressure or see the opportunity to improve its position in the industry. Intense rivalry may result from numerous or equally balanced competitors, slow industry growth, high fixed or storage costs, lack of differentiation or switching costs, over capacity in the industry, and the diversity of competition. As such, the intensity of rivalry in industries are often described using industry classifications that range from "monopoly" (one player = no rivalry) to "perfect competition" (many players = intense rivalry).


Related Posts Plugin for WordPress, Blogger...